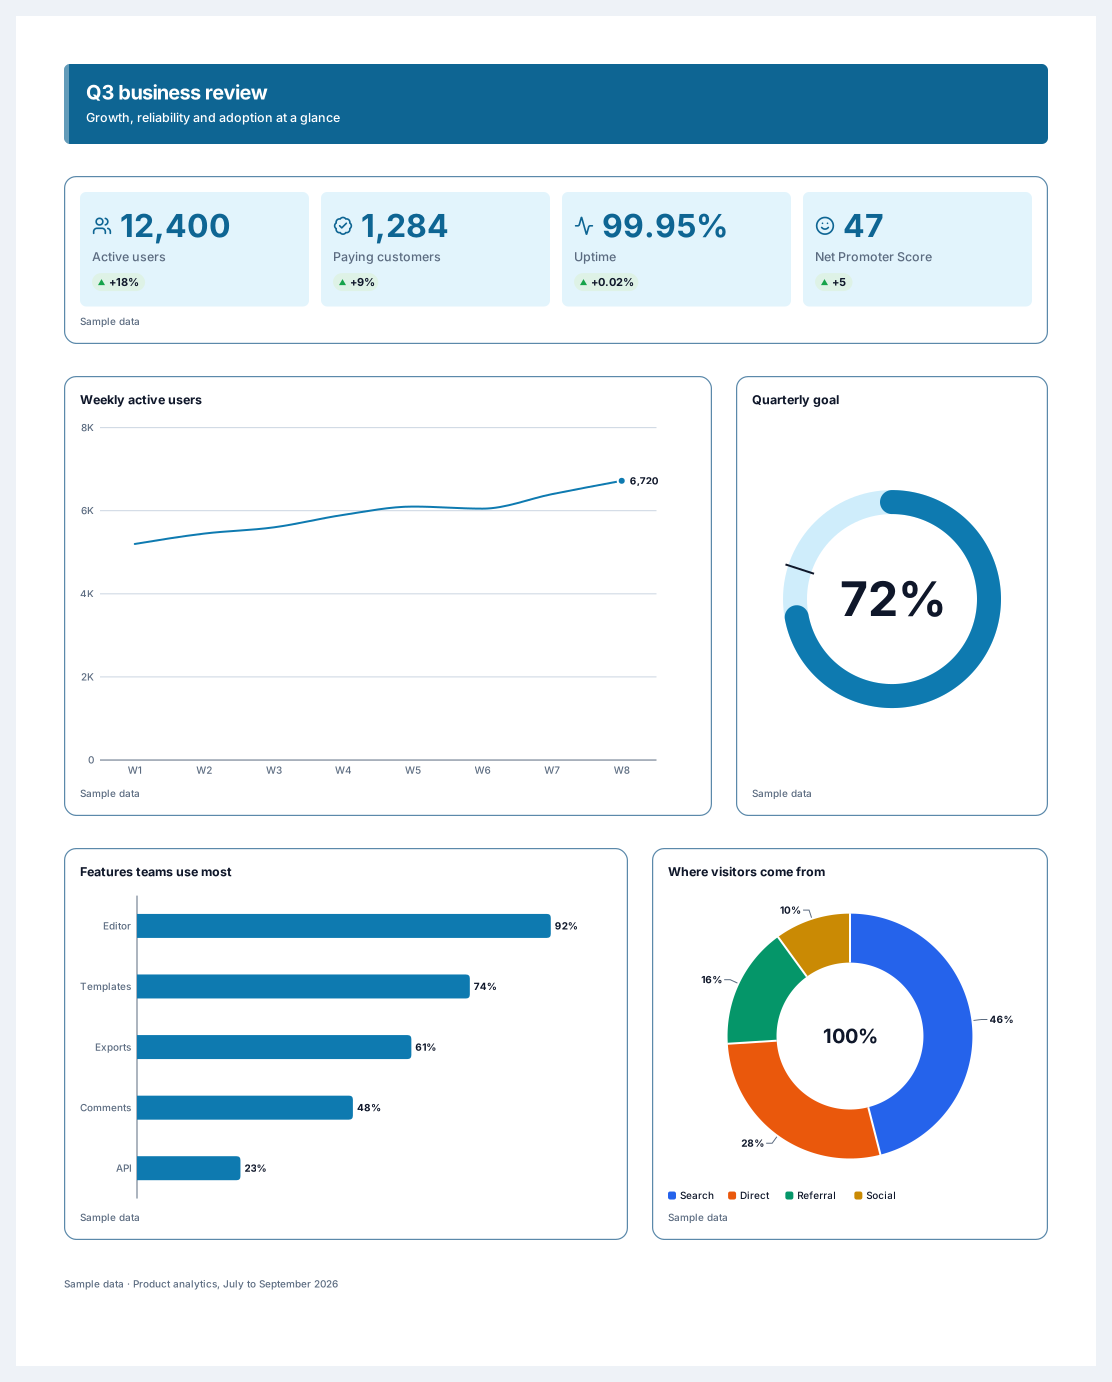
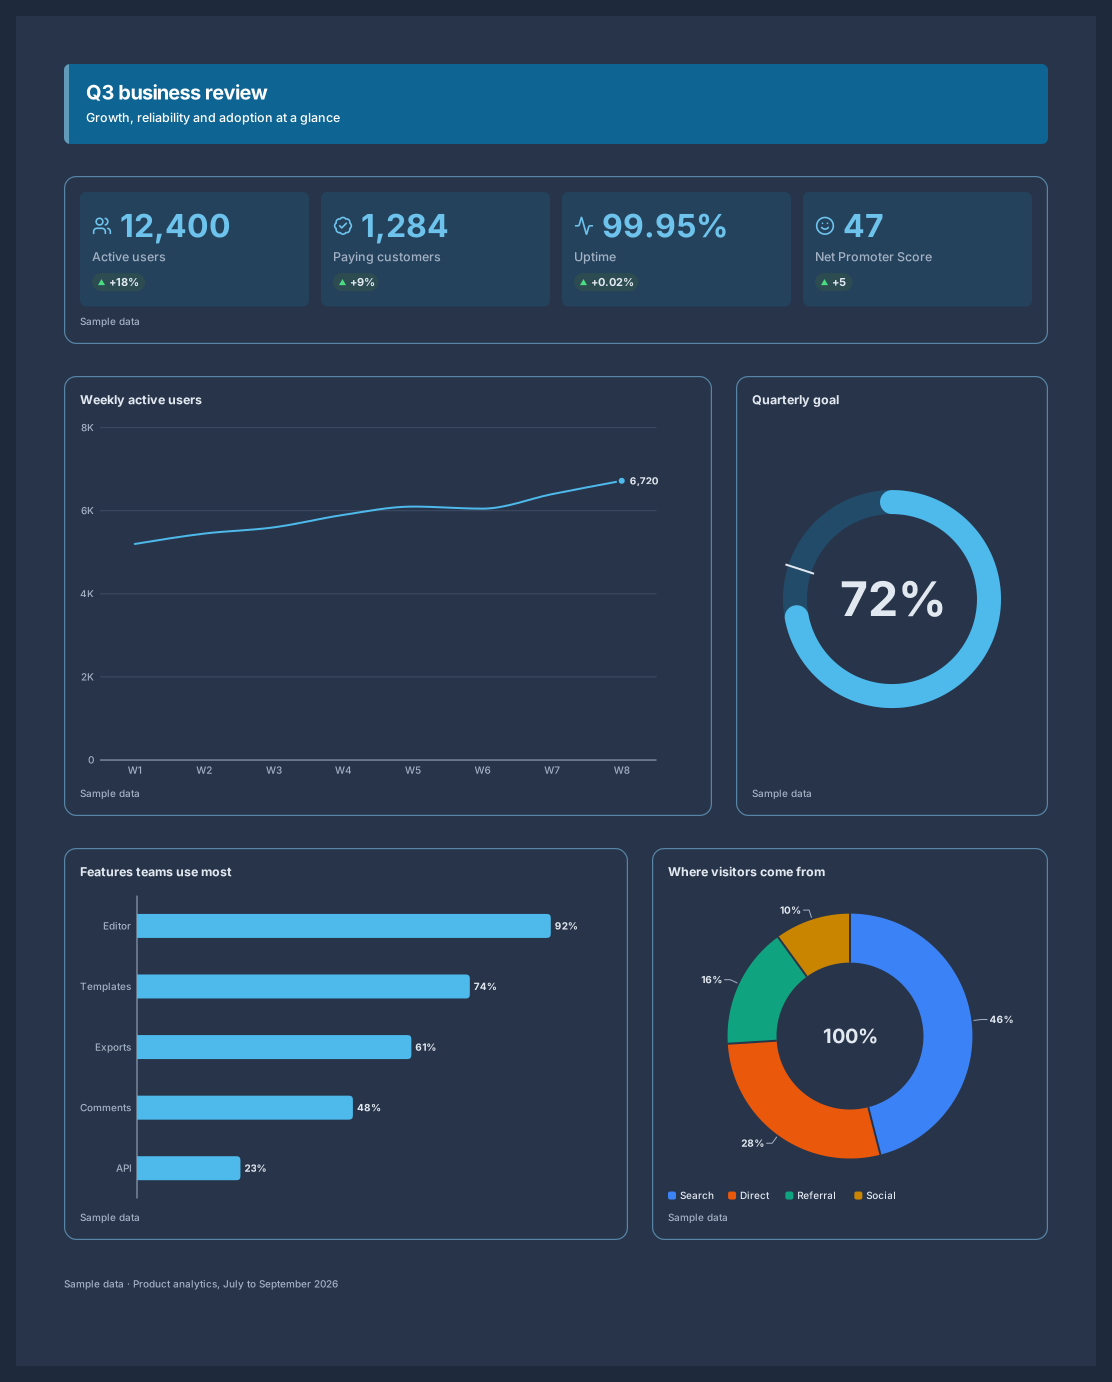
Infographic
A quadrant map and a Venn diagram that show where you stand against rivals
Works on the Free plan: 15 diagram nodes + 150 notes, text, stickers & mind map topics per diagram.
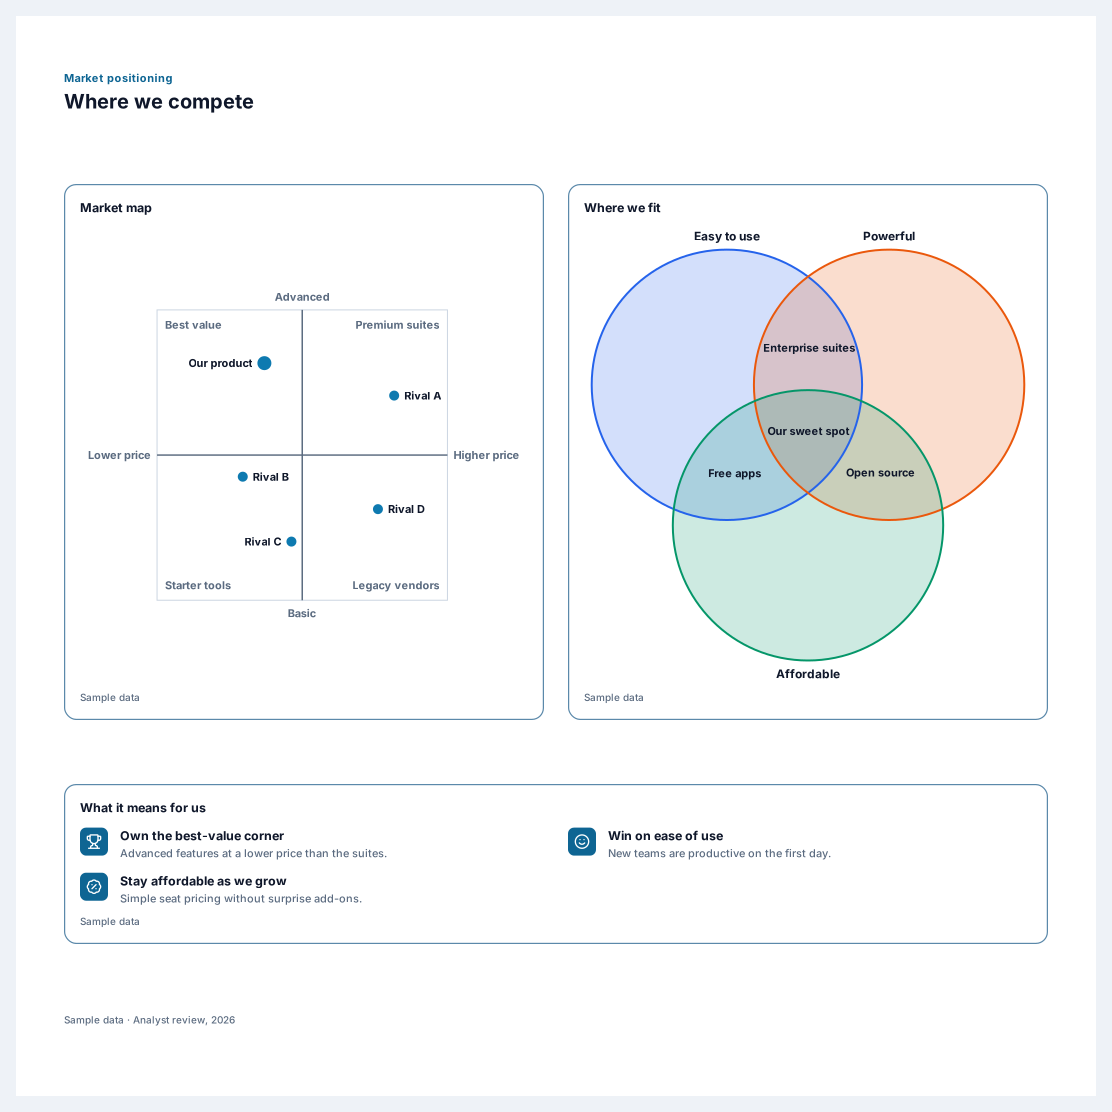
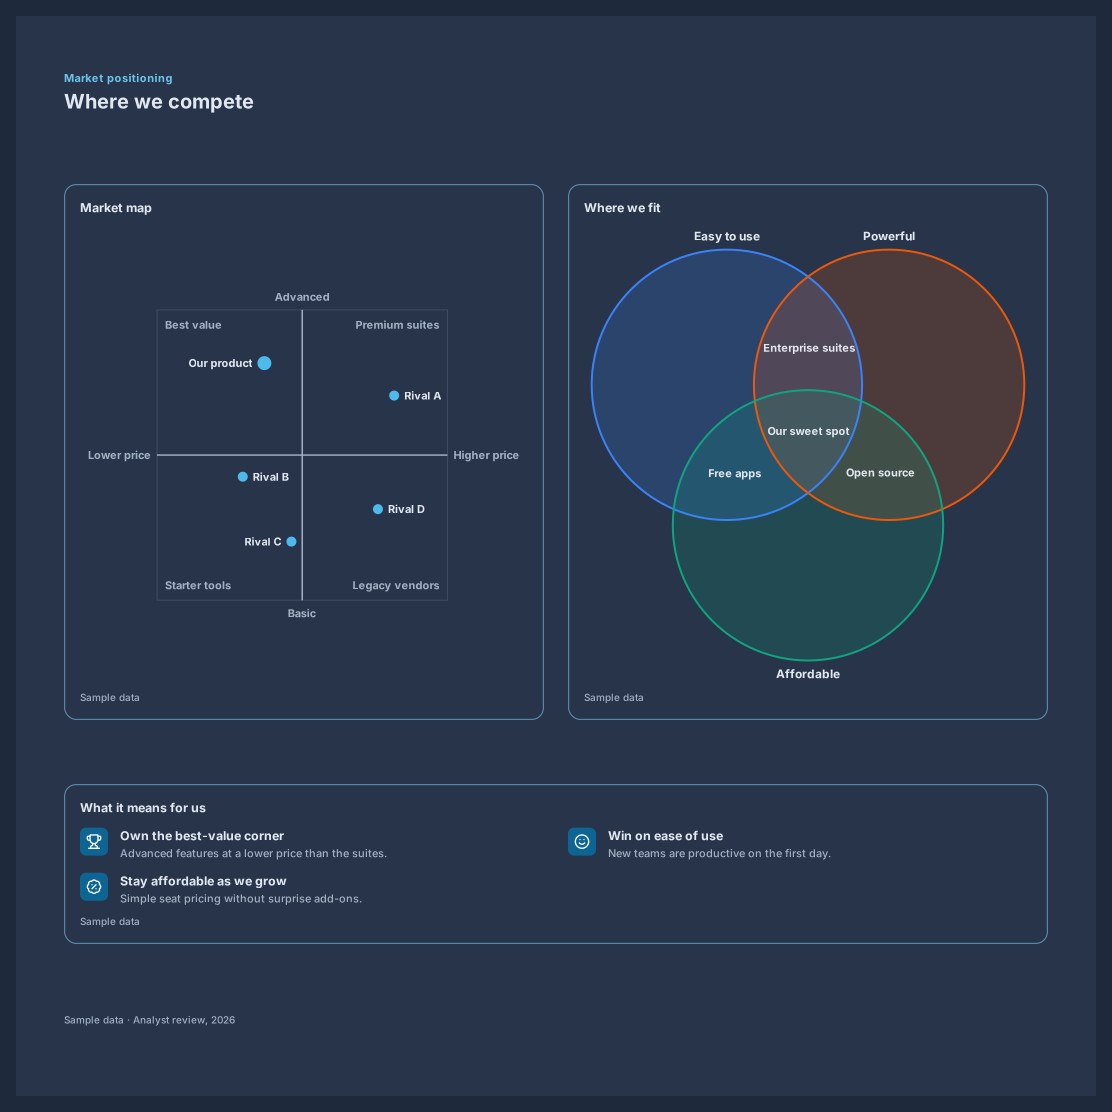
A market positioning infographic shows where a product stands against the alternatives. This template places a quadrant map, with price on one axis and capability on the other, next to a three-set Venn diagram, then lists what the picture means for your strategy and cites the source.
Each product on the map is a point with x and y values from 0 to 1 that you set in a small table, and the quadrant names follow the order used by Mermaid quadrant charts. The Venn diagram shows where qualities overlap, with your sweet spot in the middle where all three sets meet.
Rename the axes and the four quadrants to match how buyers compare your market.
Add your product and each competitor as a point, with a value between 0 and 1 on both axes.
Rename the three Venn sets and their overlaps to describe the qualities buyers care about.
Write three takeaways in the list below the map and cite where the data came from in the source line.
Up to 30 points stay readable; the block accepts more, but labels that would overlap are hidden. Use up to three tones to group competitors, for example by segment.
This map compares positions on two axes. For strengths, weaknesses, opportunities, and threats, use the SWOT analysis template, which gives each area its own zone for notes.
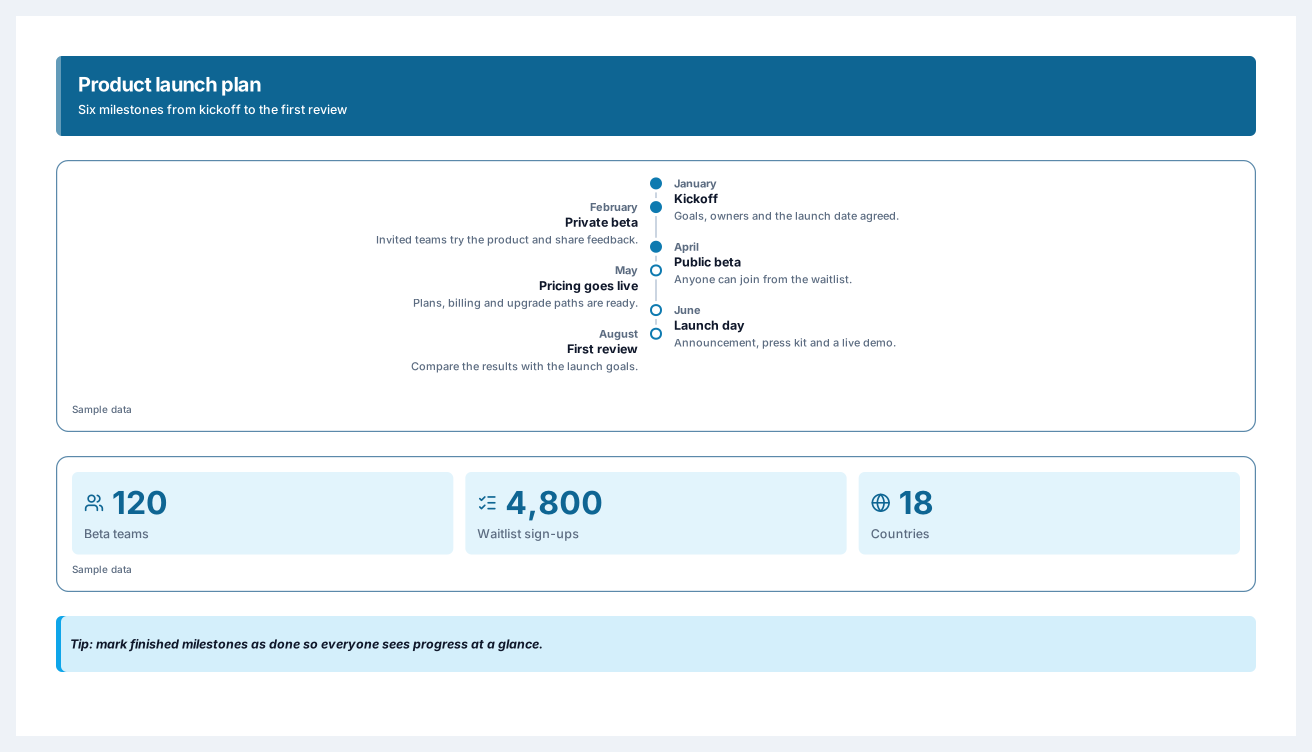
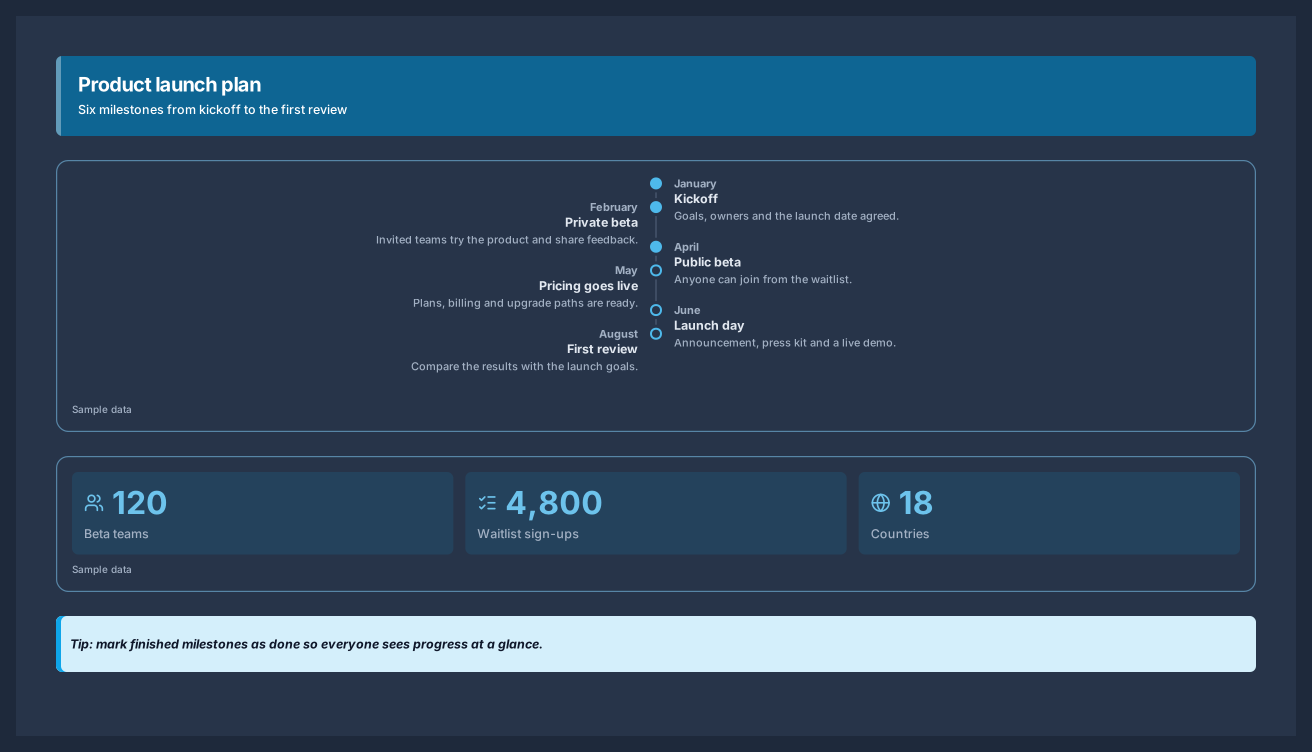
Six milestones from kickoff to launch day, with the numbers behind the plan
5 nodes
Sign in with Google or GitHub. Free for a single seat. Upgrade when the team joins.